Revelation Prophecy Chart: The Ultimate Guide to the Biblical End-Time Timeline
Revelation Prophecy Chart: The Ultimate Guide to the Biblical End-Time Timeline
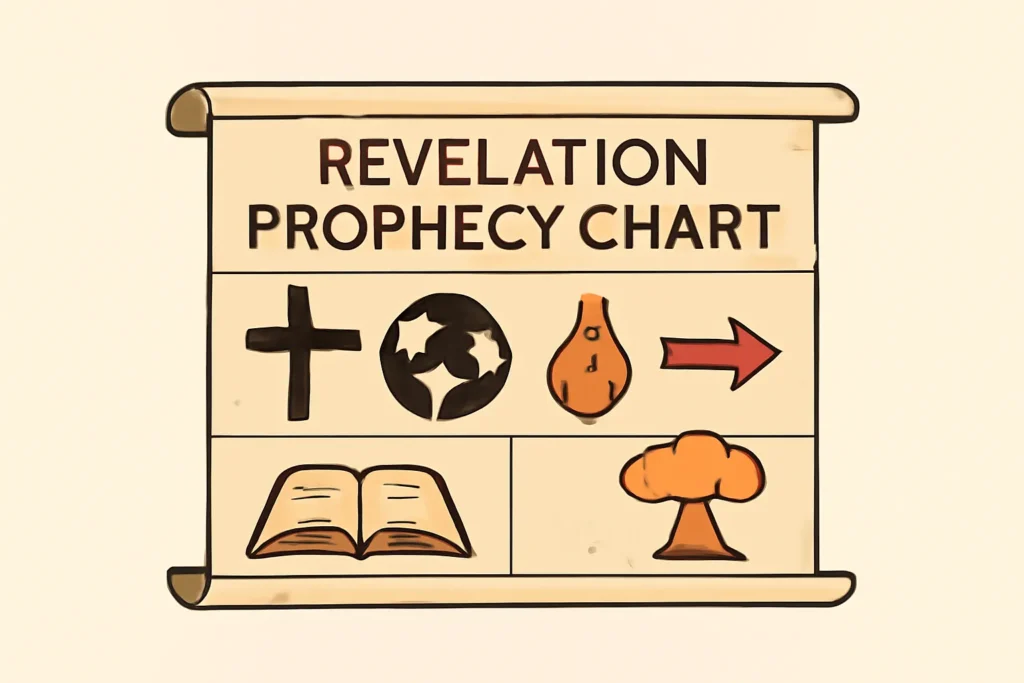
The Revelation prophecy chart, often referred to as a Revelation timeline chart, is a visual map of the end-time sequence described in the biblical book of Revelation. It functions as an educational tool to help readers organize complex imagery, symbols, and prophetic events into a coherent order. While no single chart captures every nuance of Revelation, a well-constructed diagram can illuminate patterns, cross-references to other biblical books, and the overall arc of eschatological expectation. This comprehensive guide, titled “Revelation Prophecy Chart: The Ultimate Guide to the Biblical End-Time Timeline”, explores what such charts are, how they are constructed, the major interpretive approaches, and practical steps for studying and teaching them.
A Revelation prophecy chart is a schematic representation that places prophecies, symbols, and events from the book of Revelation into a chronological or thematic framework. Unlike a plain list, a chart typically uses arrows, boxes, and labeled markers to indicate sequence, parallel events, or symbolic correspondences. The objective is not to settle every doctrinal dispute but to provide clarity about likely order and relationship among crucial moments such as judgments, the return of Christ, and the creation of a new order. Throughout this article, you will encounter several synonyms that describe the same idea: a Revelation timeline, an apocalyptic prophecy chart, and an eschatology chart. All of these phrases point to the same tool: a study aid for understanding end-time prophecy.
Why scholars and lay readers use such charts
To improve biblical literacy about Revelation’s sequence.
To explore symbolic language in context with other prophetic books like Daniel and Ezekiel.
To compare different interpretive frameworks and assess how they affect the timeline.
To facilitate teaching and discussion in study groups, classrooms, or personal devotion.
Key terms and components you’ll encounter in the end-time chart
Developing a solid grasp of core terms helps when you build or evaluate a Revelation prophecy chart. The following list highlights essential concepts that frequently appear in end-time diagrams.
Rapture or gathering of believers (as understood in some schools of interpretation).
Tribulation — a period of intense distress described in Revelation (variously interpreted as future, symbolic, or a historical pattern).
Antichrist or Beast — a central antagonist figure in Revelation’s narrative.
Beasts and Dragon — symbolic beings that power various political and spiritual forces.
Schemes of judgment — seals, trumpets, and bowls representing successive judgments on the earth.
Millennium — the thousand-year reign referenced in Revelation 20, with divergent views on its timing and nature.
New Heaven and New Earth — the culmination of God’s redemptive plan and the restoration of all things.
Second Coming — the return of Christ in glory and power, a pivotal climactic event in many charts.
Symbols and interpretive keys — numbers like 7, 666, or 12, and images such as beasts, lamb, seals, and bowls, which require careful exegesis.
Different interpretive frameworks for Revelation charts
Scholars and lay readers approach Revelation with different hermeneutical assumptions. These revelation prophecy chart frameworks influence how events are assigned to time and how literal or symbolic the sequence appears. Here are the main camps you’ll encounter.
Futurist interpretation
In this view, most or all of Revelation’s prophecies are fulfilled in the future, following a clear sequence of end-time events. A futurist chart often places the Rapture (if it is included in the model) before a defined Tribulation period, followed by the Battle of Armageddon, Christ’s return, the Millennium, and the final judgment. This framework is popular in many contemporary study Bibles and seminar materials and tends to emphasize a linear progression toward a future apex.
Preterist interpretation
The preterist approach treats most Revelation images as referring primarily to events in the first century or early church history. A chart built from this perspective reinterprets seals, trumpets, and bowls as symbolic representations of events that already occurred, such as persecutions or political upheavals in the Roman era. For readers using this lens, the end-time timeline becomes more about spiritual lessons and historic pattern-recognition than a future sequence.
Historicist interpretation
Historists view Revelation as a prophecy that unfolds across church history, with specific symbols mapped onto successive eras from the apostolic age to the present and beyond. A historicist end-times chart might align events with centuries or major historical movements, offering a broad, continuous timeline rather than a single future season. This approach has deep roots in the history of interpretation and many classic commentaries.
The idealist model treats Revelation as a timeless drama of good vs. evil, with its symbols representing enduring themes rather than concrete, literal events tied to a fixed timeline. A chart built on this basis emphasizes spiritual lessons—such as perseverance, faithfulness, and the ultimate sovereignty of God—over precise forecasting of dates or sequences.
Understanding these frameworks helps readers evaluate the assumptions behind a given apocalyptic chart and encourages careful comparison with other biblical texts, especially Daniel and the Gospels.
Core events and their placement in typical Revelation charts
Most Revelation prophecy charts attempt to connect the same core events, though the order and timing can vary. Here is a compact guide to what many diagrams include and how they are commonly positioned.
Introductory signs — general signs of the end times, religious apostasy, and moral decline described by Jesus in the Olivet Discourse and echoed in Revelation.
Rapture or gathering (in models that include it) — a possible departure of believers prior to the Tribulation; some charts exclude this event or place it after the Tribulation depending on interpretive stance.
Tribulation period — a time of intense judgment and upheaval; the length is debated (e.g., 7 years in many futurist schemes).
Judgments sequence — the series of seals, trumpets, and bowls that progressively intensify the divine response to rebellion and wickedness.
Antichrist and the Beast — a political and religious figure who consolidates power during the Tribulation, often featuring prominently in end-time diagrams.
Armageddon and final conflict — the climactic confrontation described in Revelation 16 and other passages, leading to victory for Christ.
Second Coming and general resurrection — Christ’s visible return, the defeat of evil, and the establishing of righteous rule.
Millennium — debate over the nature and timing of Christ’s thousand-year reign; some charts place it under literal reign on the earth, others see it as a spiritual reign or present reality.
Great White Throne Judgment — the final judgment that culminates at the end of the age, separating the righteous from the wicked.
New Heaven and New Earth — the consummation of God’s kingdom, where creation is renewed and believers dwell in eternal fellowship with God.
Common Revelation prophecy charts you’ll encounter
Different communities publish distinct diagrams, but they all aim to translate Revelation’s imagery into a readable sequence. Here are four representative types you’ll likely meet in books, sermons, and study guides. Each is a revelation-based chart variant that helps illustrate how scholars model the end-time timeline.
Pre-Tribulation Rapture chart
This chart positions the Rapture as occurring before the Tribulation begins. The sequence commonly looks like: rapture; antichrist arises; Tribulation period with judgments (seals, trumpets, bowls); Christ returns, followed by the Millennium and the final judgment. Proponents emphasize imminence and a clear separation between the church’s removal and the onset of judgment upon the world. Critics argue that the model can imply date-specific confidence that some readers find speculative.
In a mid-trib model, the Rapture occurs at a pivotal midpoint, often aligning with the sounding of a certain trumpet or the midpoint of a prophetic week. The Tribulation is still intense, but the church experiences part of the period on earth before departure. This approach aims to harmonize Revelation’s seals and trumpet judgments with Daniel’s timeline, while keeping the return of Christ as a climactic finale following the tribulation’s peak.
Post-Tribulation Rapture chart
The post-tribulation framework holds that the church perseveres through the entire Tribulation and is gathered at Christ’s return, which coincides with the final judgment and the establishment of the millennium. This model often stresses fidelity and endurance as core virtues and uses a unified eschatology that avoids a separate pre- or mid-rapture event.
Historicist chart
Historicist charts map Revelation’s symbols onto historical eras—from the early church through later centuries and into the future. They frequently connect beasts with political powers, river allegiances, or church-state interactions across ages. This approach has deep historical roots and can help readers see Revelation as a story that spans time, rather than a single future moment.
Each chart type has its strengths for teaching, study, and personal reflection. When evaluating a chart, consider the underlying assumptions, the intended audience, and how cross-references to Daniel, Ezekiel, and Jesus’ teachings are handled.
Symbols, imagery, and interpretive keys on the end-time map
Symbols are the currency of Revelation. A reliable Revelation prophecy chart includes a section that decodes imagery with reference to scripture, history, and literary genres. Here are some common keys used by many charts and their typical interpretive notes.
Seals — opening a scroll that initiates a sequence of judgments. Each seal introduces a new phase of judgment or event in many schemes.
Trumpets and Bowls — additional judgments that intensify as the narrative unfolds; some charts treat them as overlapping cycles or distinct crises.
Beast from the Sea and Beast from the Earth — symbolic powers representing political and religious systems that oppose God’s people.
Dragon — a representation of Satan’s boundless opposition, acting behind or through worldly powers.
Numbers — patterns such as 7 (completeness), 12 (people of God), and 666 (a symbolic marker of imperfection); many charts explain how numbers guide interpretation rather than predict exact dates.
New Heaven and New Earth — the ultimate restoration; charts often treat this as the final destination beyond all other events.
In building or evaluating a Revelation timetable, it helps to cross-check these symbols with clear biblical references and to note where symbol interpretation is contested among scholars. A thoughtful chart will label symbolically charged portions and provide a brief note or cross-reference for readers who want deeper study.
How to build your own Revelation chart: a practical guide
Constructing a personal apocalyptic chart can be an engaging way to deepen understanding. Here is a practical, step-by-step approach that respects scholarly caution and devotional use.
Define your scope. Decide whether your chart targets a futurist, historicist, preterist, or idealist interpretive framework. You may also create a hybrid model with a clear note about where the framework diverges.
Gather primary texts. Read Revelation chapters 6–22 in parallel with Daniel 7–12, Isaiah 24–27, and Jesus’ Olivet Discourse in Matthew 24–25. Mark key phrases and themes that recur across books.
Identify the major sections. Break Revelation into recognizable units: the letters to the churches, the seals, the trumpets, the bowls, and the final sections (millennium, judgment, new creation). Create a broad timeline skeleton that shows roughly where each unit appears in the sequence.
Define interpretive anchors. For each section, articulate the interpretive stance (literal, symbolic, or symbolic-literal hybrid) and note cross-references. This clarifies why you place events in certain positions on the chart.
Draft the layout. Use boxes for events, arrows for sequential movement, and shaded bands for recurring cycles (like judgments). Include a legend to explain symbols and color-coding.
Annotate with cross-references. Tie each major event to related passages in Daniel, Ezekiel, and Jesus’ teachings. This helps readers see why a chart is plausible and how it connects to the broader canon.
Incorporate multiple perspectives. If possible, present two or more labeled timelines side by side (e.g., futurist vs. historicist) or provide a note about alternative readings for each scene.
Balance accuracy and humility. Acknowledge areas of debate and avoid definitive date-setting unless supported by the text. Emphasize that the chart is a tool for understanding, not a doctrinal deadline.
Review and refine. Revisit the diagram after reading commentaries, sermons, and scholarly articles. Ensure that labels are clear, references are accurate, and the overall flow makes sense to readers new to Revelation.
Case study: correlating Daniel and Revelation on a single chronology
Many readers find it fruitful to align Revelation’s imagery with Daniel’s visions. A robust Revelation-based chronology often uses four steps: identification of parallel images, synchronization of time periods (e.g., weeks or years), interpretation of symbolic numbers, and the validation of cross-text references. For example, the beast imagery in Revelation is frequently compared with the four beasts in Daniel 7, highlighting a shared theme of imperial powers that oppress God’s people. By placing these symbols alongside each other within a chart, you can observe patterns such as cycles of judgment, opposition, and eventual divine victory. This cross-textual method helps readers appreciate the coherence of the biblical narrative while recognizing interpretive nuances between passages.
When constructing the Daniel-Revelation bridge on your chart, consider these practical approaches:
Note shared motifs, not merely shared vocabulary; recognize how both books use imagery to convey sovereignty and ultimate justice.
Track chronological cues where both books provide time-related signals, even if they are symbolic (for example, periods of seven or times of oppression in Daniel parallel certain durations in Revelation).
Highlight eschatological expectations that persist across both books, such as fidelity under pressure, divine deliverance, and the establishment of God’s eternal kingdom.
Common questions and critical considerations for end-time charts
Is it possible to predict exact dates? Most responsible chart makers emphasize that biblical prophecy primarily conveys preparedness, not precise forecasting. The emphasis should be on readiness, faithfulness, and discernment rather than exact dates.
How should one treat symbolic numbers? Numbers in Revelation often carry symbolic significance, not numerical precision. A chart should explain symbolic meanings (like completeness or imperfection) and avoid over-literalizing every numeral.
What about controversy between schools? It’s normal for there to be disagreements among interpreters. A good chart acknowledges alternate readings and provides justification for the chosen ordering or interpretation.
Does the chart undermine faith or foster uncertainty? A trustworthy chart should strengthen confidence in scripture, encourage careful study, and inspire hope in God’s sovereignty rather than create anxiety about “getting it right.”
How should a chart handle the Millennium? Given the divergent views on the Millennium (premillennial, amillennial, postmillennial), a chart may either present one preferred reading or present multiple options side by side with brief explanations.
Practical tips for studying and teaching Revelation charts
Read context first. Before relying on a chart, read Revelation in its literary context and note how images unfold within each chapter.
Cross-reference responsibly. Use reliable cross-references to Daniel, Ezekiel, and Jesus’ teaching in the Olivet Discourse to ground your chart in a broad biblical framework.
Clarify your purpose. Decide whether your chart is for personal devotion, classroom teaching, or public ministry. Tailor the level of detail and scope accordingly.
Incorporate visual hierarchy. Use color-coding, distinct shapes, and clearly labeled arrows to distinguish different streams of thought (e.g., judgments vs. redemption events).
Encourage dialogue. Present your chart as a living document that can be revised. Encourage readers to offer thoughtful feedback and to compare versions from different traditions.
Resources and reading for deeper study
For those who want to deepen their understanding of the Revelation prophecy chart, several kinds of resources are particularly helpful. A well-rounded approach combines biblical texts, scholarly commentaries, and historical perspectives to enrich your end-times diagram.
Commentaries on Revelation (ageless vs. modern) that discuss imagery, structure, and interpretation methods.
Cross-reference guides linking Revelation with Daniel, Ezekiel, Isaiah, and Jesus’ teachings.
Historical overviews showing how various Christian traditions have interpreted Revelation over the centuries.
Study Bibles with notes on symbols, dramatic imagery, and practical applications for believers today.
Educational articles and seminars that compare multiple eschatology timelines and highlight the strengths and limitations of each approach.
When using any resource, approach it with discernment and prayerful study, recognizing that the aim of a Revelation prophecy chart is to illuminate faith, not to exhaust every doctrinal detail. A wise reading combines fidelity to scripture with humility about mystery where it remains unresolved.
A well-crafted Revelation prophecy chart can be a powerful educational aid, helping Christians to engage with difficult material in a structured and meaningful way. By combining a clear timeline with solid scriptural cross-references, a robust chart fosters:
Improved biblical literacy about Revelation and related passages.
Enhanced ability to hold competing interpretations in productive dialogue.
A clearer sense of how Christians throughout history have wrestled with end-time questions.
Encouragement to live faithfully in light of the hope and warning embedded in apocalyptic literature.
Whether you adopt a futurist framework, an historicist perspective, or a symbolic-idealist approach, remember that a chart is a navigational tool. Use it to chart a course toward greater understanding, spiritual discernment, and faithful living in anticipation of God’s final redemption. As you study, let the ultimate aim be not to predict the moment of Christ’s return but to deepen trust in God’s sovereignty, cultivate hope for the new creation, and inspire godly actions in the present age.





Leave a Reply